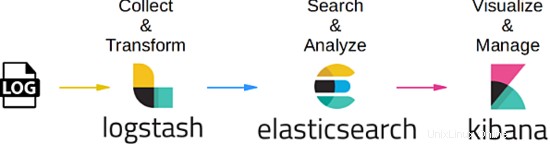
In dieser Anleitung wird erläutert, wie Sie einen zentralisierten Protokolldateiverwaltungsserver mit dem ELK-Stack unter CentOS 7 einrichten. Wie alle, die es noch nicht wissen, ist ELK die Kombination aus drei Diensten:ElasticSearch, Logstash und Kibana. Um einen vollständig zentralisierten Protokollverwaltungsserver mit diesem Konzept zu erstellen, müsste jedes dieser Pakete vorhanden sein, da es einem anderen Zweck dient und miteinander verbunden ist. Im Grunde funktioniert es so zusammen:
- Für jeden Client, den Sie verwalten möchten, wird ein eigenes Protokoll der zugehörigen Dienste erstellt.
- Für den Server, der zum Verwalten aller Protokollinformationen von jedem Client verwendet wird, verwendet er das LogStash-Paket, um die Daten zu sammeln und in einen relativen Wert umzuwandeln. Per Definition ist es eine serverseitige Open-Source-Datenverarbeitungspipeline, die Daten aus einer Vielzahl von Quellen gleichzeitig aufnimmt und transformiert
- Sobald die Daten gesammelt und umgewandelt wurden, verwendet der Verwaltungsserver ElasticSearch, um die Daten zu unterstützen und auf einen relevanten Wert zu analysieren. Sie können die allgemeine Abfragesprache verwenden, wenn Sie bei Bedarf einen zugehörigen Bericht erstellen möchten
- Da zugehörige Daten verifiziert und analysiert wurden, kommt hier das Kibana-Paket ins Spiel, da es dabei hilft, die relevanten Daten in einer richtigen Ansicht zu visualisieren und zu verwalten oder sie zum einfachen Verständnis in einem wünschenswerten Hochglanz-Dashboard zu kombinieren.
Das folgende Bild fasst den Workflow-Prozess zusammen:
1. Vorbemerkung
Für dieses Tutorial verwende ich CentOS Linux 7.4 in der 64-Bit-Version. In dieser Anleitung verwenden wir 3 Server:Der erste wird als Verwaltungsserver und die anderen 2 als Clients verwendet. Für diese Übung verwenden wir den Management-Server, um einen bestehenden MySQL-Dienst zu überwachen, der bereits eingerichtet, konfiguriert und unter jedem Client ausgeführt wurde. Da MySQL ein Datenbankdienst ist, der hauptsächlich für OLTP-Zwecke verwendet wird, werden wir unseren Verwaltungsserver dazu bringen, zwei Protokollierungsprozesse zu protokollieren, nämlich die Zustandsprüfung des MySQL-Dienstes selbst und die langsame Abfragetransaktion. Am Ende dieses Tutorials werden wir sehen, dass alle Informationen, die von einem beliebigen MySQL-Dienst innerhalb des dedizierten Clients protokolliert werden, gleichzeitig vom Verwaltungsserver direkt in Echtzeit angezeigt, visualisiert und analysiert werden können.
2. Installationsphase
Für die Installationsphase beginnen wir mit der FileBeat-Installation auf beiden MySQL-DB-Servern, die als Client fungieren. Beginnen wir mit dem Prozess. Im Folgenden sind die Schritte aufgeführt:
 [[email protected]_db1 opt]# cd
[[email protected]_db1 ~]# cd /opt/
[[email protected]_db1 opt]# wget https://artifacts.elastic.co/downloads/beats/filebeat/filebeat-6.2.1-x86_64.rpm
--2018-06-09 10:50:46-- https://artifacts.elastic.co/downloads/beats/filebeat/filebeat-6.2.1-x86_64.rpm
Resolving artifacts.elastic.co (artifacts.elastic.co)... 107.21.237.188, 107.21.253.15, 184.73.245.233, ...
Connecting to artifacts.elastic.co (artifacts.elastic.co)|107.21.237.188|:443... connected.
HTTP request sent, awaiting response... 200 OK
Length: 12697093 (12M) [binary/octet-stream]
Saving to: ‘filebeat-6.2.1-x86_64.rpm’

100%[==============================================================================>] 12,697,093 2.20MB/s in 6.9s

2018-06-09 10:51:00 (1.75 MB/s) - ‘filebeat-6.2.1-x86_64.rpm’ saved [12697093/12697093]

[[email protected]_db1 opt]# yum localinstall -y filebeat-6.2.1-x86_64.rpm
Loaded plugins: fastestmirror, ovl
Examining filebeat-6.2.1-x86_64.rpm: filebeat-6.2.1-1.x86_64
Marking filebeat-6.2.1-x86_64.rpm to be installed
Resolving Dependencies
--> Running transaction check
---> Package filebeat.x86_64 0:6.2.1-1 will be installed
--> Finished Dependency Resolution

Dependencies Resolved

========================================================================================================================
Package Arch Version Repository Size
========================================================================================================================
Installing:
filebeat x86_64 6.2.1-1 /filebeat-6.2.1-x86_64 49 M

Transaction Summary
========================================================================================================================
Install 1 Package

Total size: 49 M
Installed size: 49 M
Downloading packages:
Running transaction check
Running transaction test
Transaction test succeeded
Running transaction
Installing : filebeat-6.2.1-1.x86_64 1/1
Verifying : filebeat-6.2.1-1.x86_64 1/1

Installed:
filebeat.x86_64 0:6.2.1-1

Complete!
Sobald dies erledigt ist, listen wir das Standardmodul auf, das durch das FileBeat-Paket aktiviert wird, und aktivieren das mysql-Modul, das für unsere Fälle hier benötigt wird. Unten sind die Schritte:
 [[email protected]_db1 opt]# filebeat modules list
Enabled:

Disabled:
apache2
auditd
icinga
kafka
logstash
mysql
nginx
osquery
postgresql
redis
system
traefik
[[email protected]_db1 opt]# filebeat modules enable mysql
Enabled mysql
Fertig, jetzt bearbeiten wir die Konfiguration, die für das MySQL-Modul benötigt wird, das wir gerade aktiviert haben. Sobald wir das mysql-Modul aus dem filebeat-Paket aktiviert haben, wird standardmäßig automatisch eine yaml-Datei im Verzeichnis modules.d erstellt. Wenn die Datei jedoch nicht erstellt wurde, können Sie eine neue Yaml-Datei am selben Speicherort erstellen. Unten sind die Schritte:
 [[email protected]_db1 opt]# vi /etc/filebeat/modules.d/mysql.yml
- module: mysql
error:
enabled: true
var.paths: ["/var/lib/mysql/mysql-error.log*"]

slowlog:
enabled: true
var.paths: ["/var/lib/mysql/log-slow-queries.log*"]
Wie oben gezeigt, haben wir uns entschieden, 2 Protokollierungsprozesse vom MySQL-Dienst zu protokollieren, bei denen es sich um die Zustandsprüfung der Datenbank selbst und das Protokoll für langsame Abfragen handelt.
Nachdem alles erledigt ist, nehmen wir einige Konfigurationen in der Hauptkonfigurationsdatei für filebeat unter der Datei filebeat.yml vor. Unten ist der Konfigurationssatz:
 [[email protected]_db1 opt]# vi /etc/filebeat/filebeat.yml
#=========================== Filebeat prospectors =============================

filebeat.prospectors:

- type: log

enabled: false
paths:
- /var/lib/mysql/mysql-error.log
- /var/lib/mysql/log-slow-queries.log

#============================= Filebeat modules ===============================

filebeat.config.modules:
path: ${path.config}/modules.d/*.yml
reload.enabled: false

#==================== Elasticsearch template setting ==========================

setup.template.settings:
index.number_of_shards: 3

#================================ General =====================================

setup.kibana:

#----------------------------- Logstash output --------------------------------
output.logstash:
hosts: ["172.17.0.6:5044"]
Beachten Sie oben, dass wir eine IP-Adresse für den Logstash-Host festgelegt haben, die 172.17.0.6 lautet. Diese IP ist die Adresse für unseren zentralisierten Verwaltungsserver, der direkt durchsucht, um die Protokolldaten zu sammeln. Ich habe die fest codierte IP eingestellt, da ich keine alternativen Änderungen in der Datei /etc/hosts vorgenommen und für dieses Tutorial keinen DNS-Server verwendet habe. Sie können jedoch gerne den Hostnamen des Verwaltungsservers verwenden, wenn Sie die alternativen Änderungen vorgenommen haben.
Da alles wie geplant eingerichtet wurde, starten wir die Filebeat-Dienste. Unten sind die Schritte:
 [[email protected]_db1 opt]# filebeat setup -e
2018-06-09T11:04:37.277Z INFO instance/beat.go:468 Home path: [/usr/share/filebeat] Config path: [/etc/filebeat] Data path: [/var/lib/filebeat] Logs path: [/var/log/filebeat]
2018-06-09T11:04:37.277Z INFO instance/beat.go:475 Beat UUID: 98503460-035e-4476-8e4d-10470433dba5
2018-06-09T11:04:37.277Z INFO instance/beat.go:213 Setup Beat: filebeat; Version: 6.2.1
2018-06-09T11:04:37.277Z INFO pipeline/module.go:76 Beat name: lara
2018-06-09T11:04:37.278Z ERROR instance/beat.go:667 Exiting: Template loading requested but the Elasticsearch output is not configured/enabled
Exiting: Template loading requested but the Elasticsearch output is not configured/enabled


[[email protected]_db1 opt]# filebeat -e &
[1] 22010
[[email protected]_db1 opt]# 2018-06-09T12:45:18.812Z INFO instance/beat.go:468 Home path: [/usr/share/filebeat] Config path: [/etc/filebeat] Data path: [/var/lib/filebeat] Logs path: [/var/log/filebeat]
2018-06-09T12:45:18.813Z INFO instance/beat.go:475 Beat UUID: 98503460-035e-4476-8e4d-10470433dba5
2018-06-09T12:45:18.813Z INFO instance/beat.go:213 Setup Beat: filebeat; Version: 6.2.1
2018-06-09T12:45:18.813Z INFO pipeline/module.go:76 Beat name: lara
2018-06-09T12:45:18.813Z INFO [monitoring] log/log.go:97 Starting metrics logging every 30s
2018-06-09T12:45:18.813Z INFO instance/beat.go:301 filebeat start running.
2018-06-09T12:45:18.814Z INFO registrar/registrar.go:71 No registry file found under: /var/lib/filebeat/registry. Creating a new registry file.
2018-06-09T12:45:18.819Z INFO registrar/registrar.go:108 Loading registrar data from /var/lib/filebeat/registry
2018-06-09T12:45:18.819Z INFO registrar/registrar.go:119 States Loaded from registrar: 0
2018-06-09T12:45:18.819Z WARN beater/filebeat.go:261 Filebeat is unable to load the Ingest Node pipelines for the configured modules because the Elasticsearch output is not configured/enabled. If you have already loaded the Ingest Node pipelines or are using Logstash pipelines, you can ignore this warning.
2018-06-09T12:45:18.820Z INFO crawler/crawler.go:48 Loading Prospectors: 1
2018-06-09T12:45:18.821Z INFO log/prospector.go:111 Configured paths: [/var/lib/mysql/log-slow-queries.log*]
2018-06-09T12:45:18.822Z INFO log/prospector.go:111 Configured paths: [/var/lib/mysql/mysql-error.log*]
2018-06-09T12:45:18.822Z INFO crawler/crawler.go:82 Loading and starting Prospectors completed. Enabled prospectors: 0
2018-06-09T12:45:18.822Z INFO cfgfile/reload.go:127 Config reloader started
2018-06-09T12:45:18.840Z INFO log/prospector.go:111 Configured paths: [/var/lib/mysql/log-slow-queries.log*]
2018-06-09T12:45:18.840Z INFO log/prospector.go:111 Configured paths: [/var/lib/mysql/mysql-error.log*]
2018-06-09T12:45:18.840Z INFO cfgfile/reload.go:258 Starting 1 runners ...
2018-06-09T12:45:18.840Z INFO cfgfile/reload.go:219 Loading of config files completed.
2018-06-09T12:45:18.841Z INFO log/harvester.go:216 Harvester started for file: /var/lib/mysql/mysql-error.log
2018-06-09T12:45:18.841Z INFO log/harvester.go:216 Harvester started for file: /var/lib/mysql/log-slow-queries.log
2018-06-09T12:45:20.841Z ERROR pipeline/output.go:74 Failed to connect: dial tcp 172.17.0.6:5044: getsockopt: connection refused
2018-06-09T12:45:22.842Z ERROR pipeline/output.go:74 Failed to connect: dial tcp 172.17.0.6:5044: getsockopt: connection refused
2018-06-09T12:45:26.842Z ERROR pipeline/output.go:74 Failed to connect: dial tcp 172.17.0.6:5044: getsockopt: connection refused


[[email protected]_db1 ~]# tail -f /var/log/filebeat/filebeat
2018-06-09T10:53:28.853Z INFO instance/beat.go:468 Home path: [/usr/share/filebeat] Config path: [/etc/filebeat] Data path: [/var/lib/filebeat] Logs path: [/var/log/filebeat]
2018-06-09T10:53:28.853Z INFO instance/beat.go:475 Beat UUID: 98503460-035e-4476-8e4d-10470433dba5
Beachten Sie, dass nach dem Start des Filebeat-Dienstes ein Fehler unter dem Protokoll angezeigt wird. Dies lag daran, dass der zugewiesene Verwaltungsserver noch nicht eingerichtet war. In der Anfangsphase können Sie das Fehlerprotokoll ignorieren, da es automatisch wiederhergestellt wird, sobald unser Verwaltungsserver eingerichtet und mit dem Crawlen begonnen wurde.
Wenn die Konfiguration für die Client-Basis abgeschlossen ist, können Sie die Schritte auf dem anderen MySQL-Server replizieren, der auch als Client fungiert.
In Zukunft werden wir mit der Einrichtung des Verwaltungsservers selbst fortfahren.
3. Installationsphase (Centralized Management Server Side)
Nachdem wir nun die clientseitige Bereitschaft eingerichtet haben, starten wir die Konfiguration, die für den Verwaltungsserver selbst erforderlich ist. Kurz gesagt, es gibt 3 Kernpakete, die für den Verwaltungsserver installiert und konfiguriert werden müssen, nämlich ElasticSearch, LogStash und Kibana.
In dieser Phase beginnen wir zunächst mit der Installation und Konfiguration, die für ElasticSearch erforderlich sind. Im Folgenden sind die Schritte aufgeführt:
 [[email protected]_master ~]# cd /opt/
[[email protected]_master opt]# ls
[[email protected]_master opt]# wget https://artifacts.elastic.co/downloads/elasticsearch/elasticsearch-6.2.1.tar.gz
--2018-06-09 12:47:59-- https://artifacts.elastic.co/downloads/elasticsearch/elasticsearch-6.2.1.tar.gz
Resolving artifacts.elastic.co (artifacts.elastic.co)... 107.21.237.188, 54.235.82.130, 107.21.253.15, ...
Connecting to artifacts.elastic.co (artifacts.elastic.co)|107.21.237.188|:443... connected.
HTTP request sent, awaiting response... 200 OK
Length: 29049089 (28M) [binary/octet-stream]
Saving to: ‘elasticsearch-6.2.1.tar.gz’

100%[==============================================================================>] 29,049,089 2.47MB/s in 16s

2018-06-09 12:48:21 (1.76 MB/s) - ‘elasticsearch-6.2.1.tar.gz’ saved [29049089/29049089]

[[email protected]_master opt]#
[[email protected]_master opt]#
[[email protected]_master opt]# tar -zxvf elasticsearch-6.2.1.tar.gz

[[email protected]_master opt]# ln -s /opt/elasticsearch-6.2.1 /opt/elasticsearch
[[email protected]_master opt]# ll
total 28372
lrwxrwxrwx 1 root root 24 Jun 9 12:49 elasticsearch -> /opt/elasticsearch-6.2.1
drwxr-xr-x 8 root root 143 Feb 7 19:36 elasticsearch-6.2.1
-rw-r--r-- 1 root root 29049089 May 15 04:56 elasticsearch-6.2.1.tar.gz
Nachdem die Installation für Elasticsearch abgeschlossen ist, fahren wir mit dem Konfigurationsteil fort. Für die Konfigurationsseite weisen wir das Verzeichnis /data/data zu, um die gesammelten Protokolldaten zu speichern, die analysiert werden. Das Verzeichnis selbst wird auch zum Speichern von Indizes verwendet, die von elasticSearch selbst für schnellere Abfragen verwendet werden. Denn das Verzeichnis /data/logs wird von elasticSearch selbst für eigene Protokollierungszwecke verwendet. Unten sind die Schritte:
 [[email protected]_master opt]# mkdir -p /data/data
[[email protected]_master opt]# mkdir -p /data/logs
[[email protected]_master opt]#
[[email protected]_master opt]# cd elasticsearch
[[email protected]_master elasticsearch]# ls
bin config lib LICENSE.txt logs modules NOTICE.txt plugins README.textile
[[email protected]_master elasticsearch]# cd config/
[[email protected]_master config]# vi elasticsearch.yml
# ---------------------------------- Cluster -----------------------------------
cluster.name: log_cluster
#
# ------------------------------------ Node ------------------------------------
#
node.name: elk_master
#
# ----------------------------------- Paths ------------------------------------
#
path.data: /data/data
path.logs: /data/logs
#
network.host: 172.17.0.6
Fertig, damit ElasticSearch funktioniert, muss Java eingerichtet werden. Nachfolgend finden Sie die Schritte zum Installieren und Konfigurieren von Java auf dem Server.
 [[email protected]_master config]# wget --no-cookies --no-check-certificate --header "Cookie: gpw_e24=http%3A%2F%2Fwww.oracle.com%2F; oraclelicense=accept-securebackup-cookie" "http://download.oracle.com/otn-pub/java/jdk/8u131-b11/d54c1d3a095b4ff2b6607d096fa80163/jdk-8u131-linux-x64.rpm"
--2018-06-09 12:57:05-- http://download.oracle.com/otn-pub/java/jdk/8u131-b11/d54c1d3a095b4ff2b6607d096fa80163/jdk-8u131-linux-x64.rpm
Resolving download.oracle.com (download.oracle.com)... 23.49.16.62
Connecting to download.oracle.com (download.oracle.com)|23.49.16.62|:80... connected.
HTTP request sent, awaiting response... 302 Moved Temporarily
Location: https://edelivery.oracle.com/otn-pub/java/jdk/8u131-b11/d54c1d3a095b4ff2b6607d096fa80163/jdk-8u131-linux-x64.rpm [following]
--2018-06-09 12:57:10-- https://edelivery.oracle.com/otn-pub/java/jdk/8u131-b11/d54c1d3a095b4ff2b6607d096fa80163/jdk-8u131-linux-x64.rpm
Resolving edelivery.oracle.com (edelivery.oracle.com)... 104.103.48.174, 2600:1417:58:181::2d3e, 2600:1417:58:188::2d3e
Connecting to edelivery.oracle.com (edelivery.oracle.com)|104.103.48.174|:443... connected.
HTTP request sent, awaiting response... 302 Moved Temporarily
Location: http://download.oracle.com/otn-pub/java/jdk/8u131-b11/d54c1d3a095b4ff2b6607d096fa80163/jdk-8u131-linux-x64.rpm?AuthParam=1528549151_b1fd01d854bc0423600a83c36240028e [following]
--2018-06-09 12:57:11-- http://download.oracle.com/otn-pub/java/jdk/8u131-b11/d54c1d3a095b4ff2b6607d096fa80163/jdk-8u131-linux-x64.rpm?AuthParam=1528549151_b1fd01d854bc0423600a83c36240028e
Connecting to download.oracle.com (download.oracle.com)|23.49.16.62|:80... connected.
HTTP request sent, awaiting response... 200 OK
Length: 169983496 (162M) [application/x-redhat-package-manager]
Saving to: ‘jdk-8u131-linux-x64.rpm’

100%[==============================================================================>] 169,983,496 2.56MB/s in 64s

2018-06-09 12:58:15 (2.54 MB/s) - ‘jdk-8u131-linux-x64.rpm’ saved [169983496/169983496]

[[email protected]_master config]# yum localinstall -y jdk-8u131-linux-x64.rpm


[[email protected]_master config]# vi /root/.bash_profile
export JAVA_HOME=/usr/java/jdk1.8.0_131
PATH=$JAVA_HOME/bin:$PATH:$HOME/bin
export PATH

[[email protected]_master config]# . /root/.bash_profile
[[email protected]_master config]# java -version
java version "1.8.0_131"
Java(TM) SE Runtime Environment (build 1.8.0_131-b11)
Java HotSpot(TM) 64-Bit Server VM (build 25.131-b11, mixed mode)
Fertig, jetzt wurde elasticSearch auf dem Server installiert und konfiguriert. Aufgrund einiger Sicherheitsrichtlinien darf ElasticSearch jedoch nicht vom Benutzer root ausgeführt werden, daher werden wir einen zusätzlichen Benutzer als Eigentümer des ElasticSearch-Dienstes erstellen und ihn ausführen. Nachfolgend sind die Schritte zum Erstellen des dedizierten Benutzers dafür aufgeführt:
 [[email protected]_master config]# useradd -s /bin/bash shahril
[[email protected]_master config]# passwd shahril
Changing password for user shahril.
New password:
BAD PASSWORD: The password fails the dictionary check - it is too simplistic/systematic
Retype new password:
passwd: all authentication tokens updated successfully.

[[email protected]_master config]# chown -R shahril:shahril /data/
[[email protected]_master config]# sysctl -w vm.max_map_count=262144
vm.max_map_count = 262144
Wenn Sie fertig sind, melden Sie sich als Benutzer an und Sie können die ElasticSearch-Dienste starten.
 [[email protected]_master config]# su - shahril
Last login: Sat Jun 9 13:03:07 UTC 2018 on pts/1
[[email protected]_master ~]$
[[email protected]_master ~]$
[[email protected]_master ~]$
[[email protected]_master ~]$ /opt/elasticsearch/bin/elasticsearch &
[1] 7295
[[email protected]_master ~]$ [2018-06-09T13:06:26,667][INFO ][o.e.n.Node ] [elk_master] initializing ...
[2018-06-09T13:06:26,721][INFO ][o.e.e.NodeEnvironment ] [elk_master] using [1] data paths, mounts [[/ (rootfs)]], net usable_space [394.3gb], net total_space [468.2gb], types [rootfs]
[2018-06-09T13:06:26,722][INFO ][o.e.e.NodeEnvironment ] [elk_master] heap size [990.7mb], compressed ordinary object pointers [true]
[2018-06-09T13:06:26,723][INFO ][o.e.n.Node ] [elk_master] node name [elk_master], node ID [xjNoA9mMSGiXYmFPRNlXBg]
[2018-06-09T13:06:26,723][INFO ][o.e.n.Node ] [elk_master] version[6.2.1], pid[7295], build[7299dc3/2018-02-07T19:34:26.990113Z], OS[Linux/3.10.0-693.17.1.el7.x86_64/amd64], JVM[Oracle Corporation/Java HotSpot(TM) 64-Bit Server VM/1.8.0_131/25.131-b11]
[2018-06-09T13:06:26,723][INFO ][o.e.n.Node ] [elk_master] JVM arguments [-Xms1g, -Xmx1g, -XX:+UseConcMarkSweepGC, -XX:CMSInitiatingOccupancyFraction=75, -XX:+UseCMSInitiatingOccupancyOnly, -XX:+AlwaysPreTouch, -Xss1m, -Djava.awt.headless=true, -Dfile.encoding=UTF-8, -Djna.nosys=true, -XX:-OmitStackTraceInFastThrow, -Dio.netty.noUnsafe=true, -Dio.netty.noKeySetOptimization=true, -Dio.netty.recycler.maxCapacityPerThread=0, -Dlog4j.shutdownHookEnabled=false, -Dlog4j2.disable.jmx=true, -Djava.io.tmpdir=/tmp/elasticsearch.U6ilAwt9, -XX:+HeapDumpOnOutOfMemoryError, -XX:+PrintGCDetails, -XX:+PrintGCDateStamps, -XX:+PrintTenuringDistribution, -XX:+PrintGCApplicationStoppedTime, -Xloggc:logs/gc.log, -XX:+UseGCLogFileRotation, -XX:NumberOfGCLogFiles=32, -XX:GCLogFileSize=64m, -Des.path.home=/opt/elasticsearch, -Des.path.conf=/opt/elasticsearch/config]
[2018-06-09T13:06:27,529][INFO ][o.e.p.PluginsService ] [elk_master] loaded module [aggs-matrix-stats]
[2018-06-09T13:06:27,529][INFO ][o.e.p.PluginsService ] [elk_master] loaded module [analysis-common]
[2018-06-09T13:06:27,529][INFO ][o.e.p.PluginsService ] [elk_master] loaded module [ingest-common]
[2018-06-09T13:06:27,530][INFO ][o.e.p.PluginsService ] [elk_master] loaded module [lang-expression]
[2018-06-09T13:06:27,530][INFO ][o.e.p.PluginsService ] [elk_master] loaded module [lang-mustache]
[2018-06-09T13:06:27,530][INFO ][o.e.p.PluginsService ] [elk_master] loaded module [lang-painless]
[2018-06-09T13:06:27,530][INFO ][o.e.p.PluginsService ] [elk_master] loaded module [mapper-extras]
[2018-06-09T13:06:27,530][INFO ][o.e.p.PluginsService ] [elk_master] loaded module [parent-join]
[2018-06-09T13:06:27,530][INFO ][o.e.p.PluginsService ] [elk_master] loaded module [percolator]
[2018-06-09T13:06:27,531][INFO ][o.e.p.PluginsService ] [elk_master] loaded module [rank-eval]
[2018-06-09T13:06:27,532][INFO ][o.e.p.PluginsService ] [elk_master] loaded module [reindex]
[2018-06-09T13:06:27,532][INFO ][o.e.p.PluginsService ] [elk_master] loaded module [repository-url]
[2018-06-09T13:06:27,533][INFO ][o.e.p.PluginsService ] [elk_master] loaded module [transport-netty4]
[2018-06-09T13:06:27,533][INFO ][o.e.p.PluginsService ] [elk_master] loaded module [tribe]
[2018-06-09T13:06:27,534][INFO ][o.e.p.PluginsService ] [elk_master] no plugins loaded
Ausgezeichnet, jetzt läuft elasticSearch ohne Probleme, Sie werden feststellen, dass zusätzliche Ports innerhalb des Servers eingerichtet sind, die sich auf den ElasticSearch-Dienst beziehen. Sie können den unten aufgeführten Port überprüfen:
 [[email protected]_master config]# netstat -apn|grep -i :9
tcp 0 0 172.17.0.6:9200 0.0.0.0:* LISTEN 7295/java
tcp 0 0 172.17.0.6:9300 0.0.0.0:* LISTEN 7295/java
Kommen wir nun zum Einrichten und Konfigurieren von Logstash-Diensten. Nachfolgend sind die Schritte aufgeführt, die für den Installationsprozess erforderlich sind:
 [[email protected]_master opt]# wget https://artifacts.elastic.co/downloads/logstash/logstash-6.2.1.rpm
--2018-06-09 13:07:51-- https://artifacts.elastic.co/downloads/logstash/logstash-6.2.1.rpm
Resolving artifacts.elastic.co (artifacts.elastic.co)... 107.21.253.15, 23.21.67.46, 107.21.237.188, ...
Connecting to artifacts.elastic.co (artifacts.elastic.co)|107.21.253.15|:443... connected.
HTTP request sent, awaiting response... 200 OK
Length: 140430729 (134M) [binary/octet-stream]
Saving to: ‘logstash-6.2.1.rpm’

100%[==============================================================================>] 140,430,729 2.19MB/s in 60s

2018-06-09 13:08:57 (2.24 MB/s) - ‘logstash-6.2.1.rpm’ saved [140430729/140430729]

[[email protected]_master opt]# yum localinstall -y logstash-6.2.1.rpm
Loaded plugins: fastestmirror, ovl
Examining logstash-6.2.1.rpm: 1:logstash-6.2.1-1.noarch
Marking logstash-6.2.1.rpm to be installed
Resolving Dependencies
--> Running transaction check
---> Package logstash.noarch 1:6.2.1-1 will be installed
--> Finished Dependency Resolution

Dependencies Resolved

========================================================================================================================
Package Arch Version Repository Size
========================================================================================================================
Installing:
logstash noarch 1:6.2.1-1 /logstash-6.2.1 224 M

Transaction Summary
========================================================================================================================
Install 1 Package

Total size: 224 M
Installed size: 224 M
Downloading packages:
Running transaction check
Running transaction test
Transaction test succeeded
Running transaction
Installing : 1:logstash-6.2.1-1.noarch 1/1
Using provided startup.options file: /etc/logstash/startup.options
Successfully created system startup script for Logstash
Verifying : 1:logstash-6.2.1-1.noarch 1/1

Installed:
logstash.noarch 1:6.2.1-1

Complete!
Wenden Sie nach Abschluss der Installation die erforderliche Konfiguration wie unten beschrieben an:
 [[email protected]_master opt]# vi /etc/logstash/conf.d/02-mysql-log.conf

input {
beats {
port => 5044
host => "0.0.0.0"
}
}


filter {
if [fileset][module] == "mysql" {
if [fileset][name] == "error" {
grok {
match => { "message" => ["%{LOCALDATETIME:[mysql][error][timestamp]} (\[%{DATA:[mysql][error][level]}\] )?%{GREEDYDATA:[mysql][error][message]}",
"%{TIMESTAMP_ISO8601:[mysql][error][timestamp]} %{NUMBER:[mysql][error][thread_id]} \[%{DATA:[mysql][error][level]}\] %{GREEDYDATA:[mysql][error][message1]}",
"%{GREEDYDATA:[mysql][error][message2]}"] }
pattern_definitions => {
"LOCALDATETIME" => "[0-9]+ %{TIME}"
}
remove_field => "message"
}
mutate {
rename => { "[mysql][error][message1]" => "[mysql][error][message]" }
}
mutate {
rename => { "[mysql][error][message2]" => "[mysql][error][message]" }
}
date {
match => [ "[mysql][error][timestamp]", "ISO8601", "YYMMdd H:m:s" ]
remove_field => "[mysql][error][time]"
}
}
else if [fileset][name] == "slowlog" {
grok {
match => { "message" => ["^# [email protected]: %{USER:[mysql][slowlog][user]}(\[[^\]]+\])? @ %{HOSTNAME:[mysql][slowlog][host]} \[(IP:[mysql][slowlog][ip])?\](\s*Id:\s* %{NUMBER:[mysql][slowlog][id]})?\n# Query_time: %{NUMBER:[mysql][slowlog][query_time][sec]}\s* Lock_time: %{NUMBER:[mysql][slowlog][lock_time][sec]}\s* Rows_sent: %{NUMBER:[mysql][slowlog][rows_sent]}\s* Rows_examined: %{NUMBER:[mysql][slowlog][rows_examined]}\n(SET timestamp=%{NUMBER:[mysql][slowlog][timestamp]};\n)?%{GREEDYMULTILINE:[mysql][slowlog][query]}"] }
pattern_definitions => {
"GREEDYMULTILINE" => "(.|\n)*"
}
remove_field => "message"
}
date {
match => [ "[mysql][slowlog][timestamp]", "UNIX" ]
}
mutate {
gsub => ["[mysql][slowlog][query]", "\n# Time: [0-9]+ [0-9][0-9]:[0-9][0-9]:[0-9][0-9](\\.[0-9]+)?$", ""]
}
}
}
}


output {
elasticsearch {
hosts => "172.17.0.6"
manage_template => false
index => "%{[@metadata][beat]}-%{[@metadata][version]}-%{+YYYY.MM.dd}"
}
}
Beachten Sie, dass wir aus der oben vorgenommenen Konfiguration die Eingabe so eingestellt haben, dass sie vom filebeat-Dienst auf der Clientseite genommen wird, der Port 5044 verwendet. Wir haben auch eine richtige Anmerkung für logstash gesetzt, um die Rohdaten abzugleichen, die von jeder Clientseite genommen wurden. Dies ist erforderlich, damit es von der ElasticSearch-Seite aus einfacher angezeigt und analysiert werden kann.
Als nächstes müssen wir das Filebeats-Modul für Logstash installieren, damit Logstash die Rohdaten von der Client-Seite erfassen und crawlen kann.
 [[email protected]_master opt]# /usr/share/logstash/bin/logstash-plugin install logstash-input-beats
Validating logstash-input-beats
Installing logstash-input-beats
Installation successful
Wenn die für Logstash erforderliche Installation und Konfiguration abgeschlossen ist, können wir die Dienste direkt starten. Unten sind die Schritte:
 [[email protected]_master opt]# service logstash restart
Redirecting to /bin/systemctl restart logstash.service

[[email protected]_master opt]# service logstash status
Redirecting to /bin/systemctl status logstash.service
? logstash.service - logstash
Loaded: loaded (/etc/systemd/system/logstash.service; disabled; vendor preset: disabled)
Active: active (running) since Sat 2018-06-09 13:17:40 UTC; 5s ago
Main PID: 8106 (java)
CGroup: /docker/2daaf895e0efa67ef70dbabd87b56d53815e94ff70432f692385f527e2dc488b/system.slice/logstash.service
??8106 /bin/java -Xms256m -Xmx1g -XX:+UseParNewGC -XX:+UseConcMarkSweepGC -XX:CMSInitiatingOccupancyFracti...

Jun 09 13:17:40 elk_master systemd[1]: Started logstash.
Jun 09 13:17:40 elk_master systemd[1]: Starting logstash...
[[email protected]_master opt]#

[[email protected]_master opt]# tail -f /var/log/logstash/logstash-plain.log
[2018-06-09T13:17:59,496][INFO ][logstash.outputs.elasticsearch] Elasticsearch pool URLs updated {:changes=>{:removed=>[], :added=>[http://172.17.0.6:9200/]}}
[2018-06-09T13:17:59,498][INFO ][logstash.outputs.elasticsearch] Running health check to see if an Elasticsearch connection is working {:healthcheck_url=>http://172.17.0.6:9200/, :path=>"/"}
[2018-06-09T13:17:59,976][WARN ][logstash.outputs.elasticsearch] Restored connection to ES instance {:url=>"http://172.17.0.6:9200/"}
[2018-06-09T13:18:00,083][INFO ][logstash.outputs.elasticsearch] ES Output version determined {:es_version=>nil}
[2018-06-09T13:18:00,083][WARN ][logstash.outputs.elasticsearch] Detected a 6.x and above cluster: the `type` event field won't be used to determine the document _type {:es_version=>6}
[2018-06-09T13:18:00,095][INFO ][logstash.outputs.elasticsearch] New Elasticsearch output {:class=>"LogStash::Outputs::ElasticSearch", :hosts=>["//172.17.0.6"]}
[2018-06-09T13:18:00,599][INFO ][logstash.inputs.beats ] Beats inputs: Starting input listener {:address=>"0.0.0.0:5044"}
[2018-06-09T13:18:00,652][INFO ][logstash.pipeline ] Pipeline started succesfully {:pipeline_id=>"main", :thread=>"#<Thread:[email protected]/usr/share/logstash/logstash-core/lib/logstash/pipeline.rb:246 sleep>"}
[2018-06-09T13:18:00,663][INFO ][org.logstash.beats.Server] Starting server on port: 5044
[2018-06-09T13:18:00,660][INFO ][logstash.agent ] Pipelines running {:count=>1, :pipelines=>["main"]}
[2018-06-09T13:18:24,060][INFO ][o.e.c.m.MetaDataCreateIndexService] [elk_master] [filebeat-6.2.1-2018.06.04] creating index, cause [auto(bulk api)], templates [], shards [5]/[1], mappings []
[2018-06-09T13:18:24,189][INFO ][o.e.c.m.MetaDataCreateIndexService] [elk_master] [filebeat-6.2.1-2018.06.09] creating index, cause [auto(bulk api)], templates [], shards [5]/[1], mappings []
[2018-06-09T13:18:24,288][INFO ][o.e.c.m.MetaDataCreateIndexService] [elk_master] [filebeat-6.2.1-2018.06.08] creating index, cause [auto(bulk api)], templates [], shards [5]/[1], mappings []
[2018-06-09T13:18:24,591][INFO ][o.e.c.m.MetaDataMappingService] [elk_master] [filebeat-6.2.1-2018.06.04/yPD91Ww0SD2ei4YI-FgLgQ] create_mapping [doc]
[2018-06-09T13:18:24,781][INFO ][o.e.c.m.MetaDataMappingService] [elk_master] [filebeat-6.2.1-2018.06.08/Qnv0gplFTgW0z1C6haZESg] create_mapping [doc]
[2018-06-09T13:18:24,882][INFO ][o.e.c.m.MetaDataMappingService] [elk_master] [filebeat-6.2.1-2018.06.09/dihjTJw3SjGncXYln2MXbA] create_mapping [doc]
[2018-06-09T13:18:24,996][INFO ][o.e.c.m.MetaDataMappingService] [elk_master] [filebeat-6.2.1-2018.06.09/dihjTJw3SjGncXYln2MXbA] update_mapping [doc]
As you can see, now logstash service have successfully started and starting to collect the data from each client side. As alternatives, you can use curl command to see the status and updates from logstash side. Below are the examples:
 [[email protected]_master opt]# curl -kL http://172.17.0.6:9200/_cat/indices?v
health status index uuid pri rep docs.count docs.deleted store.size pri.store.size
yellow open filebeat-6.2.1-2018.06.09 dihjTJw3SjGncXYln2MXbA 5 1 6 0 35.2kb 35.2kb
yellow open filebeat-6.2.1-2018.06.04 yPD91Ww0SD2ei4YI-FgLgQ 5 1 350 0 186.4kb 186.4kb
yellow open filebeat-6.2.1-2018.06.08 Qnv0gplFTgW0z1C6haZESg 5 1 97 0 89.4kb 89.4kb
Last but not least, we'll need to setup and configure kibana services to make a complete centralized management server. Just a footnote, as kibana are used to ease the process of gathering and analyzing the data through visualization, it is not an important packages like elasticSearch or logstash if you are setting up the server under a smaller box. Yet to proceed, below are the steps on installation and configuration:
 [[email protected]_master opt]# wget https://artifacts.elastic.co/downloads/kibana/kibana-6.2.1-linux-x86_64.tar.gz
--2018-06-09 13:21:41-- https://artifacts.elastic.co/downloads/kibana/kibana-6.2.1-linux-x86_64.tar.gz
Resolving artifacts.elastic.co (artifacts.elastic.co)... 107.21.237.188, 107.21.237.95, 107.21.253.15, ...
Connecting to artifacts.elastic.co (artifacts.elastic.co)|107.21.237.188|:443... connected.
HTTP request sent, awaiting response... 200 OK
Length: 83465500 (80M) [binary/octet-stream]
Saving to: ‘kibana-6.2.1-linux-x86_64.tar.gz’

100%[==============================================================================>] 83,465,500 2.76MB/s in 41s

2018-06-09 13:22:28 (1.94 MB/s) - ‘kibana-6.2.1-linux-x86_64.tar.gz’ saved [83465500/83465500]

[[email protected]_master opt]# tar -zxvf kibana-6.2.1-linux-x86_64.tar.gz
[[email protected]_master opt]# ln -s /opt/kibana-6.2.1-linux-x86_64 /opt/kibana

[[email protected]_master opt]# vi kibana/config/kibana.yml

server.host: "172.17.0.6"
server.port: 5601
elasticsearch.url: "http://172.17.0.6:9200"
Noted on above that I've link the kibana with our ElasticSearch service inside the configuration and assign a port that will be use by Kibana service once started. Now as everything are already set in place, we can startup the final services. Unten sind die Schritte:
 [[email protected]_master opt]# /opt/kibana/bin/kibana --version
6.2.1

[[email protected]_master opt]# /opt/kibana/bin/kibana &
[1] 8640
[[email protected]_master opt]# log [13:26:20.034] [info][status][plugin:[email protected]] Status changed from uninitialized to green - Ready
log [13:26:20.073] [info][status][plugin:[email protected]] Status changed from uninitialized to yellow - Waiting for Elasticsearch
log [13:26:20.193] [info][status][plugin:[email protected]] Status changed from uninitialized to green - Ready
log [13:26:20.200] [info][status][plugin:[email protected]] Status changed from uninitialized to green - Ready
log [13:26:20.212] [info][status][plugin:[email protected]] Status changed from uninitialized to green - Ready
log [13:26:20.233] [info][listening] Server running at http://172.17.0.6:5601
log [13:26:20.276] [info][status][plugin:[email protected]] Status changed from yellow to green - Ready


[[email protected]_master opt]# netstat -apn|grep -i :5601
tcp 0 0 172.17.0.6:5601 0.0.0.0:* LISTEN 8640/node
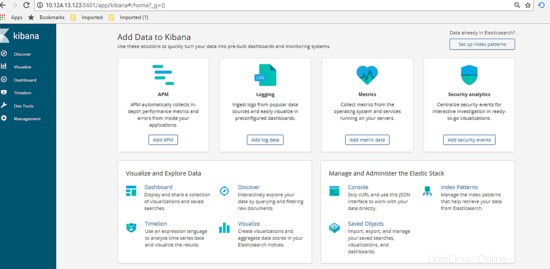
Great, now everything are up and running as per shown above using the netstat command. Now let's view the Dashboard of Kibana and made the configuration. Got to url http://172.17.0.6:5601/app , you'll see the dashboard will be shown like below.
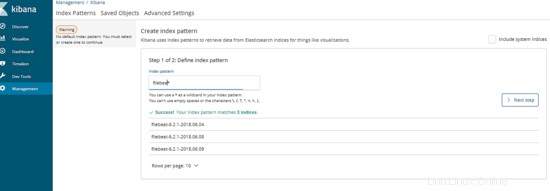
Next on the dashboard, click on Management tab then define the index pattern, for our cases the index pattern are define as our logging filename generated. Type in the information then click next.
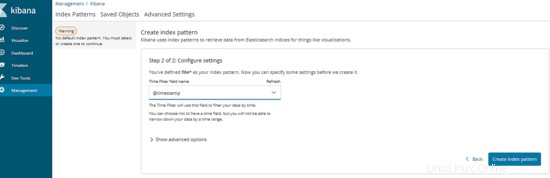
After that, type in the variables that will be use as time series. Once done, click Create Index Pattern. Below are the example:
Excellent, now the management server are ready to be use. Let's proceed by testing the usability.
4. Testphase
Before we start the test, let's make the assumption for final result expections. For this test, we will try to execute a database query that will pass the long query time assign from client which is MySQL server. Once we execute, our centralized management server should automatically show the result of slow query information as graph via Kibana dashboard. Now as everything is clear, let's start the test, below are the step:
Log into any of the client server and execute the slow query SQL like below:
 [[email protected]_db1 ~]# mysql --login-path=root -P 3306 --prompt='TEST>'
Welcome to the MySQL monitor. Commands end with ; or \g.
Your MySQL connection id is 193
Server version: 5.7.21-log MySQL Community Server (GPL)

Copyright (c) 2000, 2018, Oracle and/or its affiliates. All rights reserved.

Oracle is a registered trademark of Oracle Corporation and/or its
affiliates. Other names may be trademarks of their respective
owners.

Type 'help;' or '\h' for help. Type '\c' to clear the current input statement.

TEST>select sleep(5);
+----------+
| sleep(5) |
+----------+
| 0 |
+----------+
1 row in set (5.01 sec)

TEST>select sleep(6);
+----------+
| sleep(6) |
+----------+
| 0 |
+----------+
1 row in set (6.00 sec)

TEST>select sleep(10) 'run for 10 seconds';
+--------------------+
| run for 10 seconds |
+--------------------+
| 0 |
+--------------------+
1 row in set (10.00 sec)

TEST>select sleep(3) 'test again';
+------------+
| test again |
+------------+
| 0 |
+------------+
1 row in set (3.00 sec)

TEST>exit
Bye
As shown above, we've manage to produce some of slow query that automatically jotted into each client slow query log. Now, let's go to the dashboard and see if the data information successfully been crawl by centralized server and convert it as visualization graph.
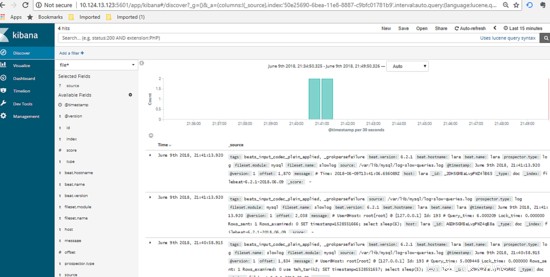
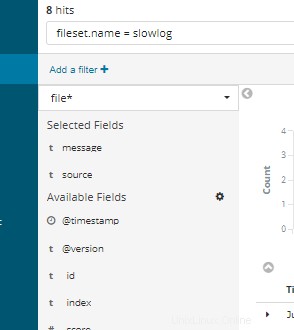
Great, as per shown above there are list of logging information succcessfully been crawl and viewed through kibana dashboard. You can use the left tab to filter what type of column you want to show or hide, below are the example :-
Using the textfield on top of the dashboard, you can type in SQL query related to view certain information or part of the data needed.
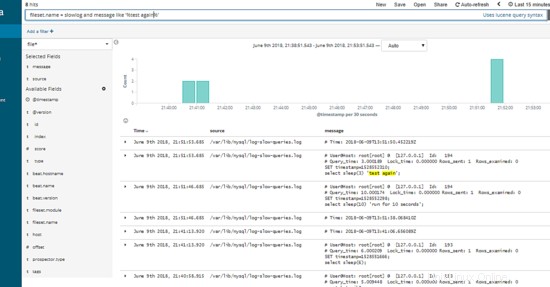
Excellent, as show above the slow query SQL that we've produce initially from 1 of our client server automatically shown under our Kibana Dashboard per expected.